MarketTracker North Bay - March 2025 from CharlieBrownSF

The Big Story
Quick Take:
Affordability remains a concern across the country despite lower interest rates compared to this time last year.
New homes are being added to the market, with the US seeing a 4.21% year-over-year increase in the number of new listings in February.
Inventory is getting back to healthier levels as we see backlogs begin to build across the country.
Note: You can find the charts & graphs for the Big Story at the end of the following section.
*National Association of REALTORS® data is released two months behind, so we estimate the most recent month's data when possible and appropriate.
Affordability continues to be an issue nationwide
One of the headline issues in the real estate industry over the past few years has been, of course, the affordability (or rather the unaffordability) of homes. Unfortunately for new buyers, and more specifically first time home-buyers, this issue looks like it will persist throughout 2025. Mortgage rates remain comparatively high, and home prices largely have not given back their pandemic-era gains.
This has, of course, made the dreams of homeownership difficult to achieve for countless people around the country. With the median monthly principal and interest payment exceeding $2,100 per month on a nationwide level, people are struggling to afford the purchase of a new home!
New homes are starting to hit the market again
Fortunately for the market, there are plenty of new homes hitting the market though. While there are countless people sitting on the sidelines, waiting for lower interest rates to sell their current home and buy a new one, some of these holdouts are giving up and listing their homes. The writing seems to be on the wall, meaning more and more people are giving up on the thought that we will see lower interest rates in the short term, causing them to list their homes.
This has resulted in a pleasant jump in new home listings, despite us being at the tail end of the slow season. In the month of february, we saw more than 353,000 homes hit the market nationwide. This represents a 4.21% increase on a year-over-year basis, and an 8.15% increase on a month-over-month basis!
Inventories are beginning to build, offering more options for buyers
Since we are seeing new inventory hit the market and a steady level of demand, this is causing inventories to build, which is a great sign for those looking to enter the market! In the month of January, there were 1,180,000 homes listed on the market, representing a 16.83% increase on a year-over-year basis and a 3.51% increase on a month-over-month basis. At the same time, we’re seeing demand stagnate a bit, with 4,080,000 homes sold in January, representing a 2% increase when compared to last year and a 4.9% decrease when compared to last month!
Although a top-tier property will likely end up in a bidding war, no matter if it’s in Kansas City or Calabasas, this increase in inventory could mean that there are some deals to be had on listings that sit on the market for a few weeks.
While there are areas that deviate from the national trends, this is generally what's happening nationwide. Below, you'll find a local lowdown that provides you with the in-depth coverage of your area that you need. We will continue to monitor the housing market and overall economy to help guide you in buying or selling your home.
Big Story Data


The Local Lowdown
Quick Take:
Inventory continues to be a huge problem throughout San Francisco, with continued year-over-year declines.
Median sale prices continue to gyrate around the 2-year average, as supply and demand move roughly in-line with each other.
Single-family homes continue to be a hot commodity, while condos continue to sit on the market.
Note: You can find the charts/graphs for the Local Lowdown at the end of this section.
What’s Moving: Sold Homes & Upcoming Listings in SF
Looking to buy or sell? Interview me for the job...
Call Charlie 415-722-3493.
Prices increase throughout the entire North Bay!
Although there was a lot of uncertainty as to how this year would start off, the market has been good to the North Bay so far! Single-family homes have retained their values (and increased in value in many cases) throughout the area, with Sonoma, Marin, and Solano county sale prices growing by roughly 3% on a year-over-year basis and Napa county sale prices growing by just over 21%! This just goes to show just how in-demand homes in the area are!
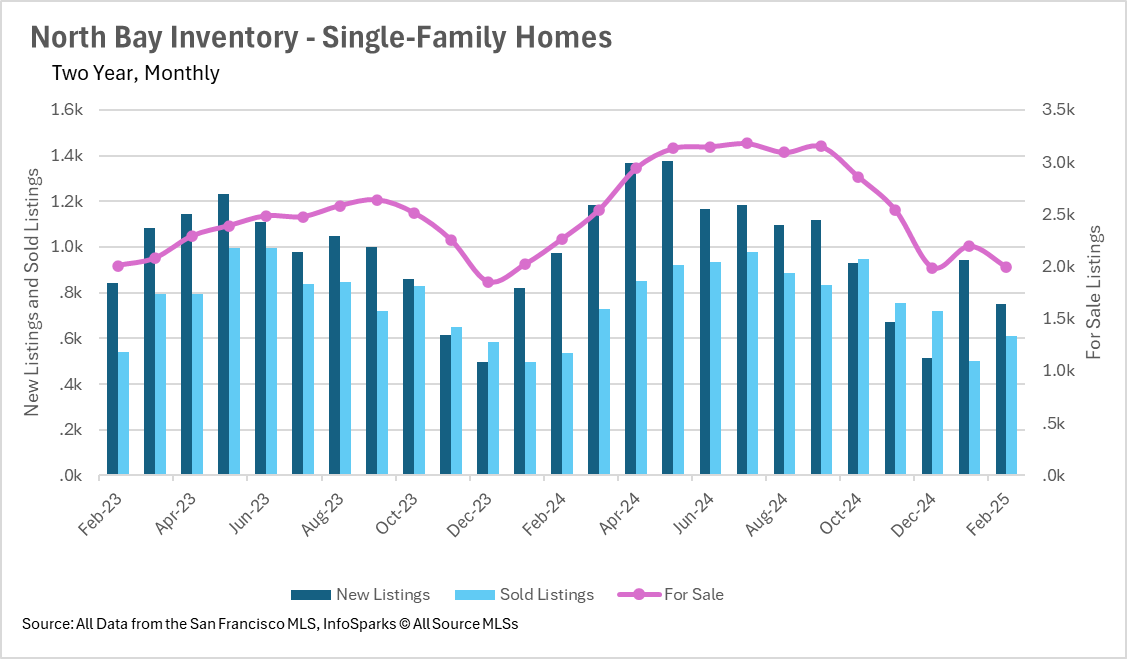
North Bay inventory levels continue to decrease year-over-year
Although at a nationwide level, we’re seeing sellers give in to higher interest rates, causing existing inventory to build in the market, we’re not seeing the same thing in the North Bay. Despite nationwide increases in inventory, the number of active single-family home listings has decreased by 12.02% on a year-over-year basis in the North Bay. It is important to note that the condo market did see a slight increase in inventory of 6.14%, but this represents a much smaller segment of the market.
This overall decrease in inventory suggests that buyers continue to enter into bidding wars to secure the homes of their dreams. Of course, this has led listings to stay on the market for shorter periods of time, with the average home staying on the market for 32 days in Sonoma, 18 days in Marin, and 36 days in Solano, representing year-over-year decreases of 5.88%, 5.26%, and 5.26%, respectively.
It’s important to note though, that although Napa saw a spike in median sale price this past month, the area also saw a huge spike in the number of days on market for single-family homes, with the average listing sitting on the market for 84 days, nearly double the amount of time a listing was sitting on the market around this time last year!
Napa continues to be a buyers’ market, while Solano, Marin, and Sonoma see fierce competition
When determining whether a market is a buyers’ market or a sellers’ market, we look to the Months of Supply Inventory (MSI) metric. The state of California has historically averaged around three months of MSI, so any area with at or around three months of MSI is considered a balanced market. Any market that has lower than three months of MSI is considered a seller’s market, whereas markets with more than three months of MSI are considered buyers’ markets.
In terms of the single-family home market, we’re seeing Sonoma, Marin, and Solano continue to be seller’s markets, with just 2.5, 1.8, and 2.2 months' worth of supply on the market at this point in time. Whereas Napa continues to be a buyers’ market, with 4.7 months of inventory on the market. The condo market at large remains a buyers’ market too, with 3.1 months of supply on the market in Sonoma, 3.6 months in Marin, 3.8 months in Solano, and 4.9 months in Napa.